


With the implementation of Undi18 and automatic voter registration, around 5.6 million new voters entered the electoral roll (of which 1.2 million new voters are ages 18 to 20), and this significantly altered the electorate composition of parliament and state (Dun) constituencies.
What is the current state of constituencies and what are the key considerations for a fair redelineation process? Did the malapportionment worsen?
One of the four criteria to ensure fair redelineation in Malaysia is to ensure that constituencies have nearly equal electorate sizes throughout the state.
Since population distribution is non-uniform and local community ties have to be considered, it is impossible for a constituency to have an equal population to its neighbours.
To prevent malapportionment, the Constitution ought to have clear limits on a constituency’s electorate size. Currently, the Constitution does not define clear limits for a constituency’s electorate size (hence, allowing malapportionment).
Since every constituency sends one elected representative each, uneven constituency sizes have resulted in discrimination against Malaysians. Moreover, the Parliament has received complete control of parliamentary constituency allocation since 1973. This resulted in constituencies being distributed to states arbitrarily, not on evolving state electorate/population sizes.
The Election Commission (EC) had the power to add or remove constituencies among Peninsular Malaysian states before 1973 due to population/electorate sizes. This ability was stripped away due to the outcomes of 1960 and 1971-73 redelineation exercises and then political considerations.
This article primarily focuses on studying intrastate malapportionment (unequal constituency sizes within a state) among parliamentary constituencies and its relationship with key demographic features.
To find the parliamentary constituencies that are malapportioned, a constituency that is not within +/-15 percent of a state’s Parliamentary Electoral Quota (EQ) (average size of parliamentary constituency in each state) would be considered as oversized (too many electors) or undersized (too little electors) accordingly. We are referring to the 1957 constitutional principles.
For Sabah and Sarawak, suggested limits for a constituency’s electorate size would be +/-25 percent of the state’s Parliamentary EQ. As Labuan and Putrajaya have one single parliamentary constituency each, intrastate malapportionment cannot be measured.
Did the implementation of Undi18 worsen or, at best, retain existing malapportionment? With considerations in the above, let us examine the comparison of 2020 (pre-Undi18) and 2021 (post-Undi18) electoral rolls.
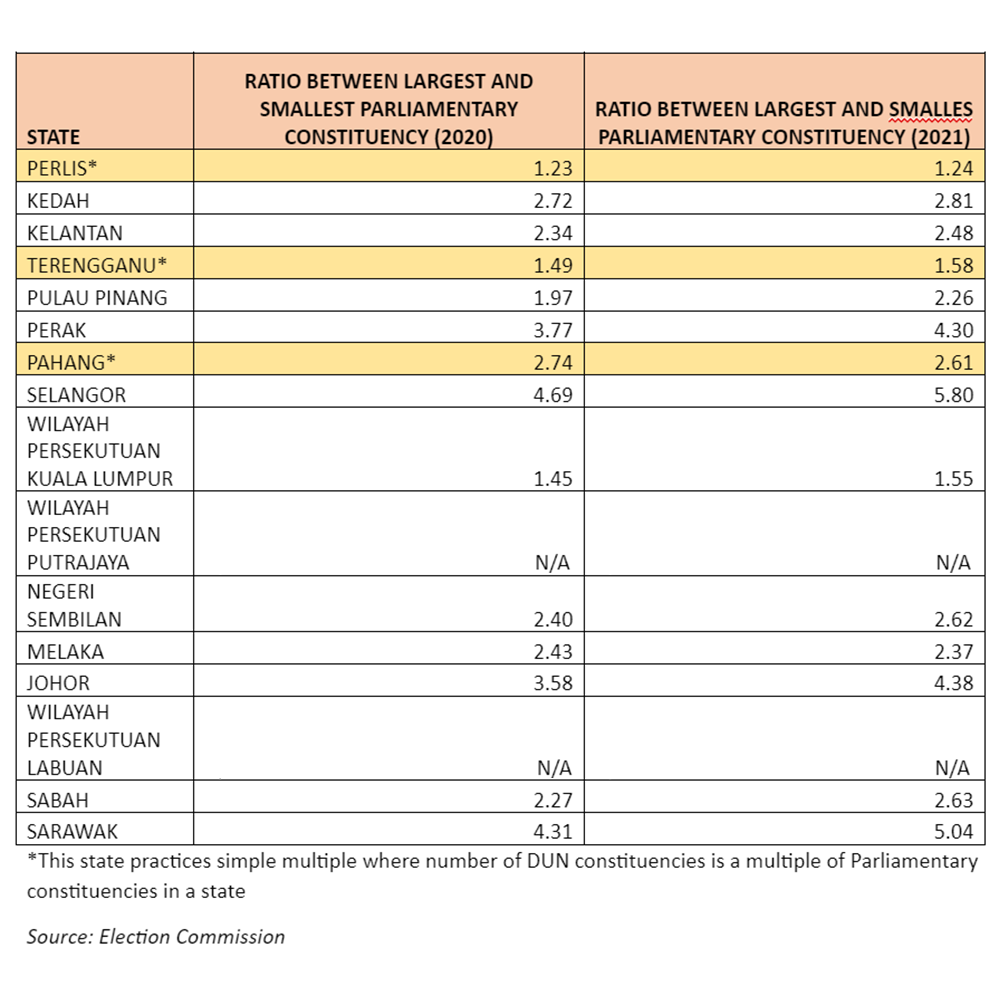
Before Undi18, many of the current constituencies were in violation of the principle of equality. Undi18’s implementation has widened the disparity between the largest and the smallest parliamentary constituencies for all states except Pahang.
The widening was more pronounced in states that did not practice simple multiples. The majority of the oversized constituencies cover state capitals and major cities across Malaysia (with some exceptions like Baling, Bachok and Beruas). Half of the oversized constituencies are Malay-majority areas.
The implementation of Undi18 is not one of the three triggers for redelineation. The three triggers for redelineation are:
Change of state boundaries/admission of new states.
Any time after eight years from the previous redelineation exercise.
Change in the number of constituencies (Dewan Rakyat or Dun).
Before we clamour for solutions, we need to grasp the nature of constituencies and how it relates to malapportionment.
Malapportionment and youth voters
Among all parliamentary constituencies, 132 constituencies have 20 percent to 30 percent of their electorate coming from ages of between 18 and 30 (youth voter category).
Within 164 Peninsular Malaysian (excluding Putrajaya) constituencies, constituencies with 20 percent to 30 percent youth voters are largely classified as equal-sized constituencies, followed by undersized constituencies. Within the 56 East Malaysian (excluding Labuan) constituencies, constituencies with 20 percent to 30 percent youth voters are largely classified as undersized constituencies, followed by equal-sized constituencies.
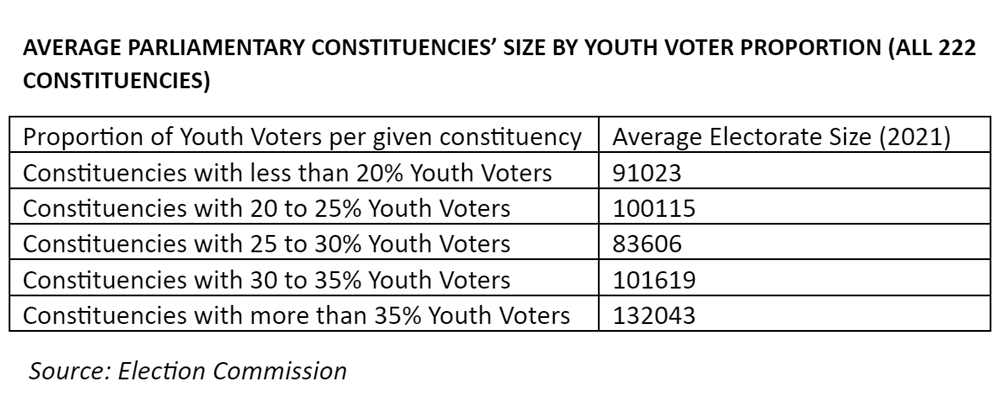
Youth voters found in constituencies with more than 35 percent of the electorate coming from youth backgrounds have less voting value compared to youth in constituencies with a low presence of youth voters (i.e., less than 20 percent of the electorate are youth).
Constituencies with low youth vote presence are generally Chinese majority or mixed urban constituencies, which cover areas of older sections of George Town, Ipoh, Kuala Lumpur, Kota Kinabalu and Kuching.
Malapportionment and ethnicity
Unequal constituencies are inextricably linked to ethnic composition since our parliamentary constituencies were formed at the beginning. The 1960 redelineation exercise tried to rectify the imbalance using population and electorate sizes, and this ended EC’s independence.
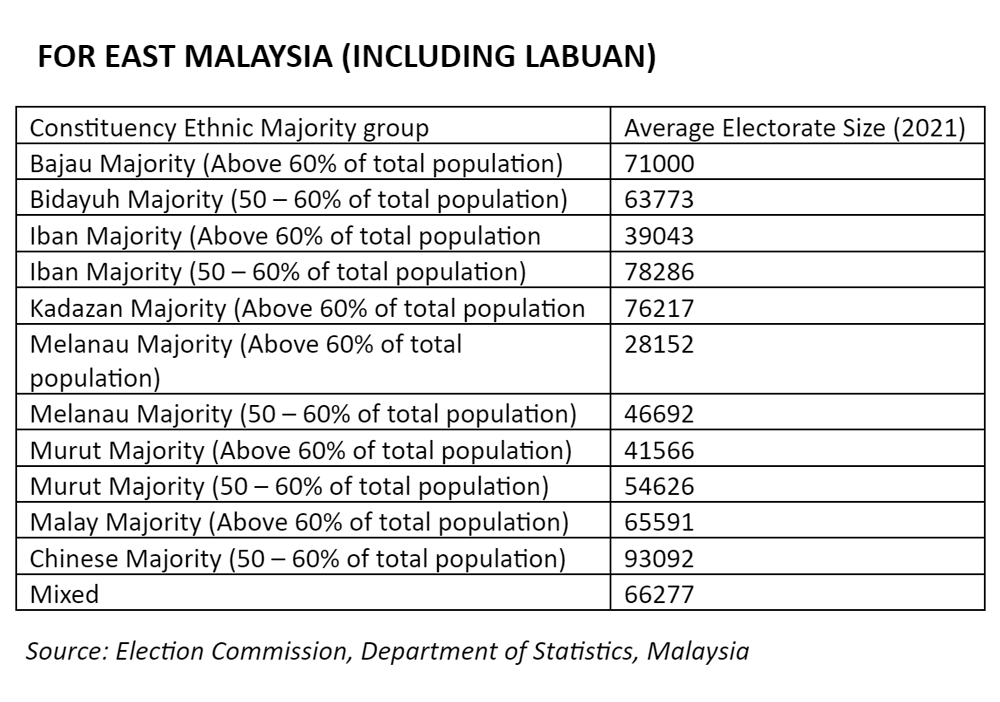
Since then, using urbanisation and ethnicity factors, Malaysian voters have been suffering discrimination through our regular redelineation exercises. The two tables below show the average parliamentary electorate sizes by ethnic group classification (using 2020 population – not electors – data).
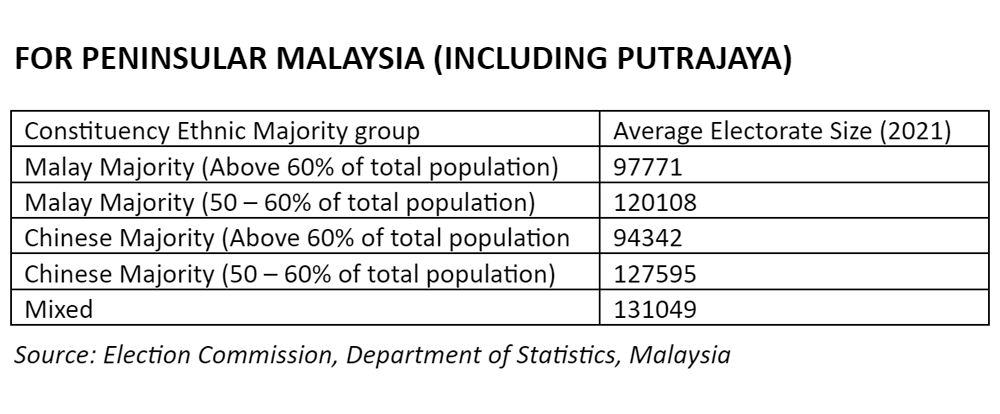
A common pattern emerges from the tables above. The average parliamentary constituency size which is ethnically more homogeneous (i.e., Malay majority [above 60 percent]) is smaller than the average parliamentary constituency that is mixed or less homogenous (i.e., Malay majority [50–60 percent]).
Within Peninsular Malaysia (excluding Putrajaya), Malay-majority constituencies constitute 26 out of 42 oversized parliamentary constituencies. For East Malaysia, Chinese-majority constituencies are largely oversized, and this mirrors the urban nature of constituencies.
Among bumiputera Sabah and Sarawak majority parliamentary constituencies, certain ethnic groups have greater voting powers compared to others within a state.
Inequality, poverty, and unemployment
In this subsection, we will examine three economic features for parliamentary constituencies – inequality, poverty, and unemployment rate.
Malaysian inequality has been declining since the 1980s but started to widen from 2016 to 2019. The Gini coefficient measures the degree of inequality in the distribution of income/wealth and values range from 0 to 1 (0 represents perfect equality and 1 represents perfect inequality).
Malaysia’s Gini coefficient stands around 0.407 in 2019, while United Nations Economic and Social Commission for Asia and the Pacific (UNESCAP) aspires a country in this region to have a Gini coefficient of 0.295.
Only 15 parliamentary constituencies in Malaysia have attained this target (all in Peninsular Malaysia). The majority of these constituencies are equal-sized or undersized constituencies. These constituencies are a mixture of rural and urban areas outside the city core (e.g., Jelutong, Wangsa Maju and Pandan).
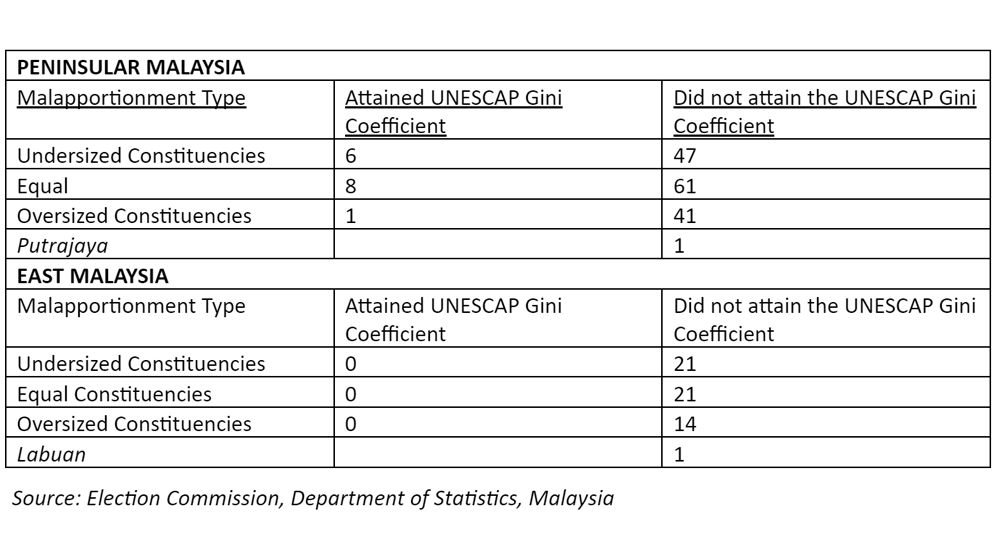
While the majority of constituencies fall within the Gini coefficient value between 0.3 and 0.4 (irrespective of electorate size), constituencies with larger electorate sizes are marginally more unequal compared to others.
If we were to compare the Gini coefficient of parliamentary constituencies with their own home state Gini coefficient value, the majority of the constituencies in Peninsular Malaysia (excluding Putrajaya) - 116 out 165 – have Gini coefficient values lower (hence more equal wealth distribution) than the state level.
For the remaining constituencies in Peninsular Malaysia (48), 21 equal-sized constituencies, 17 oversized constituencies and 10 undersized constituencies have Gini coefficient higher (greater inequality) than the state level. For East Malaysian (excluding Labuan) parliamentary constituencies, the majority of them have a lower Gini coefficient value than their state Gini coefficient value.
Moving from inequality to poverty levels, the revised Poverty Line Income in 2019 has shown that 5.6 percent of national households are living in absolute poverty figures.
UNESCAP aspires a country to keep its national poverty levels to 7.0 percent or lower. If we use this aspired target to assess parliamentary constituencies, around 126 parliamentary constituencies have kept their poverty levels lower than 7.0 percent.
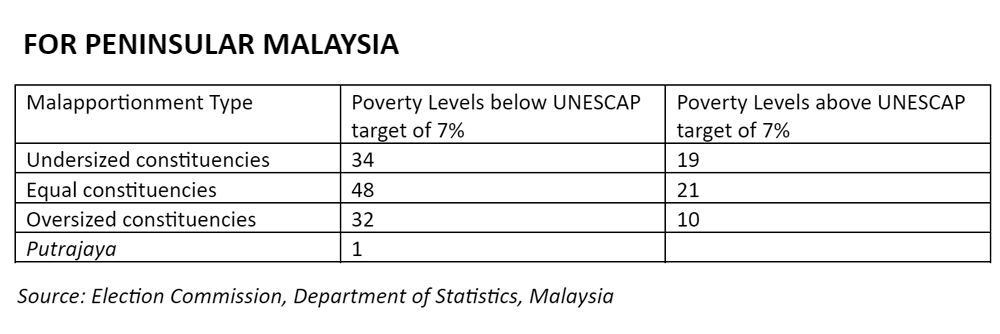
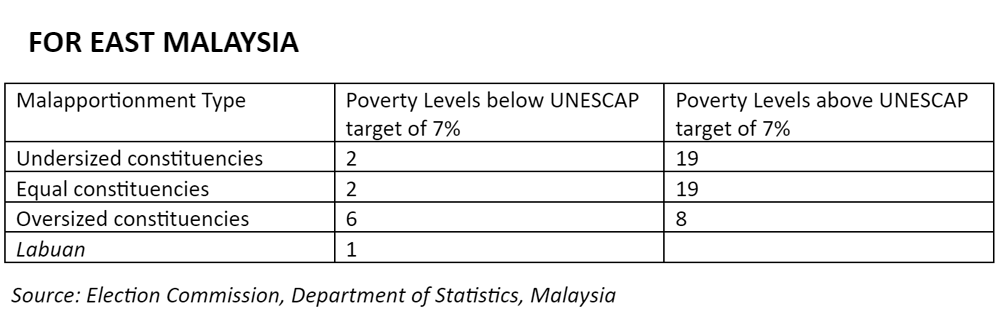
Undersized constituencies have higher poverty levels in comparison to oversized constituencies. This difference is very stark in East Malaysia.
In Peninsular Malaysia, the average absolute poverty rate for an undersized constituency is 6.12 percent, while for oversized constituencies, it is 4.61 percent. This is compared to East Malaysia where the average absolute poverty rate for an undersized constituency is 18.71 percent, while for oversized constituencies, it is 8.78 percent.
For the unemployment rate, UNESCAP aspires to a rate of 2.6 percent, and 17 (all in Peninsular Malaysia) constituencies nationally have kept the rates lower than 2.6 percent. These constituencies (e.g., Cameron Highlands, Kota Melaka) come from varied urbanisation and economic backgrounds.
Let us assess whether there is a pattern of unemployment rate among varied sizes of constituencies (using the national level unemployment rate of 3.3 percent in 2019).
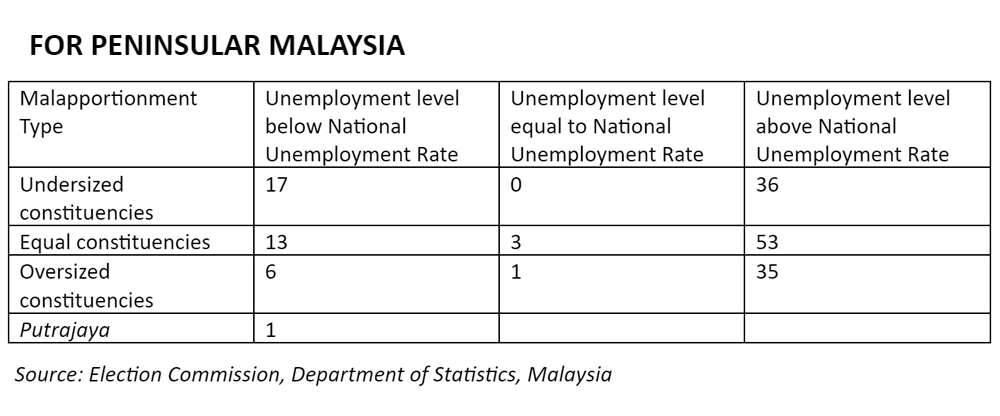
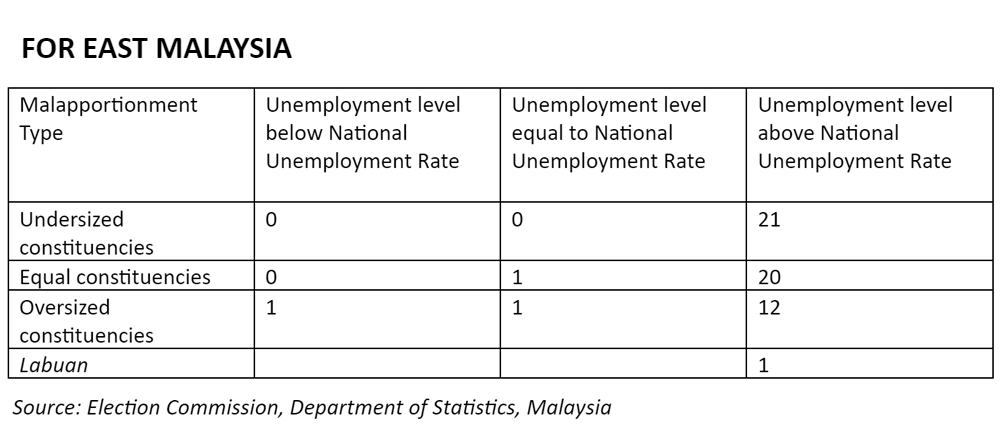
The majority of parliamentary constituencies record unemployment rates higher than the national level, irrespective of the electorate size of the constituencies.
Among Peninsular Malaysian constituencies, the difference in unemployment rates (on average) among equal, oversized, or undersized constituencies is very small (variation of 0.2 percent). For East Malaysian constituencies, an equal-sized constituency on average will have a 6.9 percent unemployment rate, followed by 5.6 percent for undersized constituencies and 5.2 percent for oversized constituencies.
Key findings
From the examination of the association of demographic and economic attributes of constituencies and malapportionment, here are the key findings for us to ponder:
Undi18 has worsened unaddressed malapportionment.
Malapportionment has indirectly discriminated against youth voters in younger constituencies.
Malapportionment has created an unnecessary divide among Malaysians, whether within or among ethnic groups.
While most of the constituencies have a Gini coefficient value between 0.3 and 0.4, oversized constituencies have marginally higher inequality.
Undersized constituencies generally have higher absolute poverty prevalence compared to other constituencies. The difference is very stark in East Malaysia.
The unemployment rate should be a concern for all constituencies.
With all these in mind, we can focus on a step-by-step process of realising fair redelineation for all constituencies of the Dewan Rakyat and the state assemblies.- Mkini
DANESH PRAKASH CHACKO is a research analyst at Jeffrey Sachs Center on Sustainable Development (Sunway University). He also serves as the director of Tindak Malaysia, an electoral reform advocacy group.
The views expressed here are those of the author/contributor and do not necessarily represent the views of MMKtT.
No comments:
Post a Comment
Note: Only a member of this blog may post a comment.